Skip to content

Reporting & Data Visualization

Turn complex data into useful answers

To get the most value from your GRC program, you need to explore your data, discover patterns and outliers, and share your insights with others. Our intuitive self-service reporting options accelerate discovery and allow everyone to share insights in a governed way.

Dashboard Self-Service

Dashboards are a common way for business users to access their data. Our dashboards enable users with a wide variety of skills to design, create and publish dashboards quickly and easily.

Fast.

Build dashboards quickly

Quick Charts enable you to build visualizations directly within the dashboard. You can compose your dashboards without having to flip between report creation and dashboard building tools. Choose from a wide variety of visualizations to communicate your data in the best way possible.

illustrator-hub-spoke-no-bg

6clicks Pixel Perfect Report Generator

Leverage the power of the 6clicks custom report generator and save hours on every assessment or audit.

illustration-report-generator
icon-content-packs

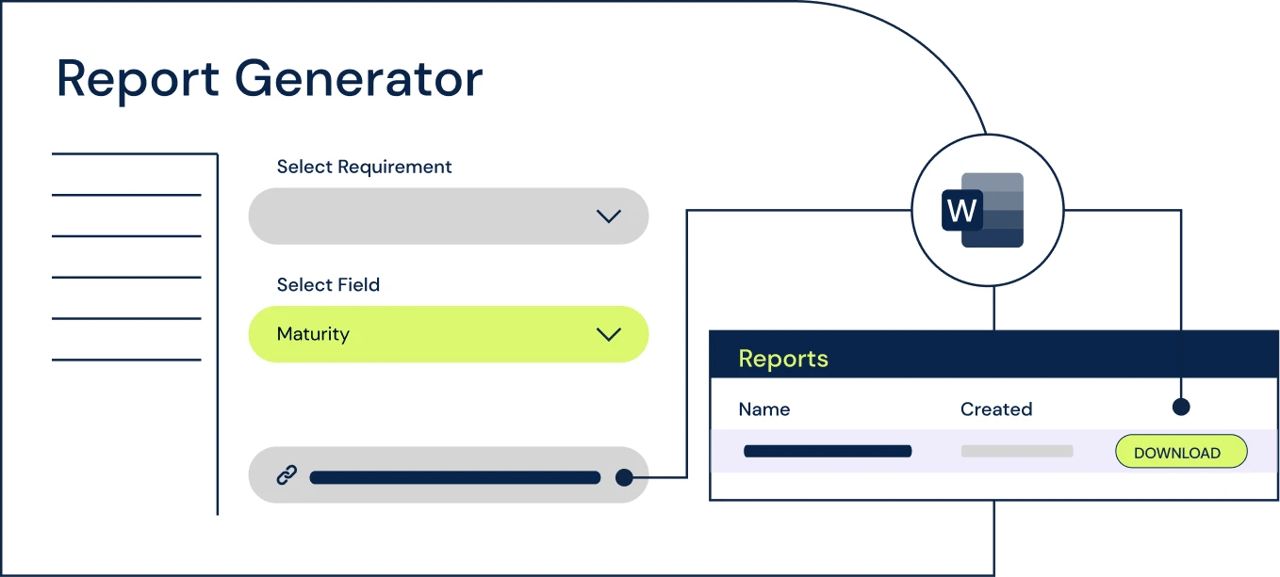
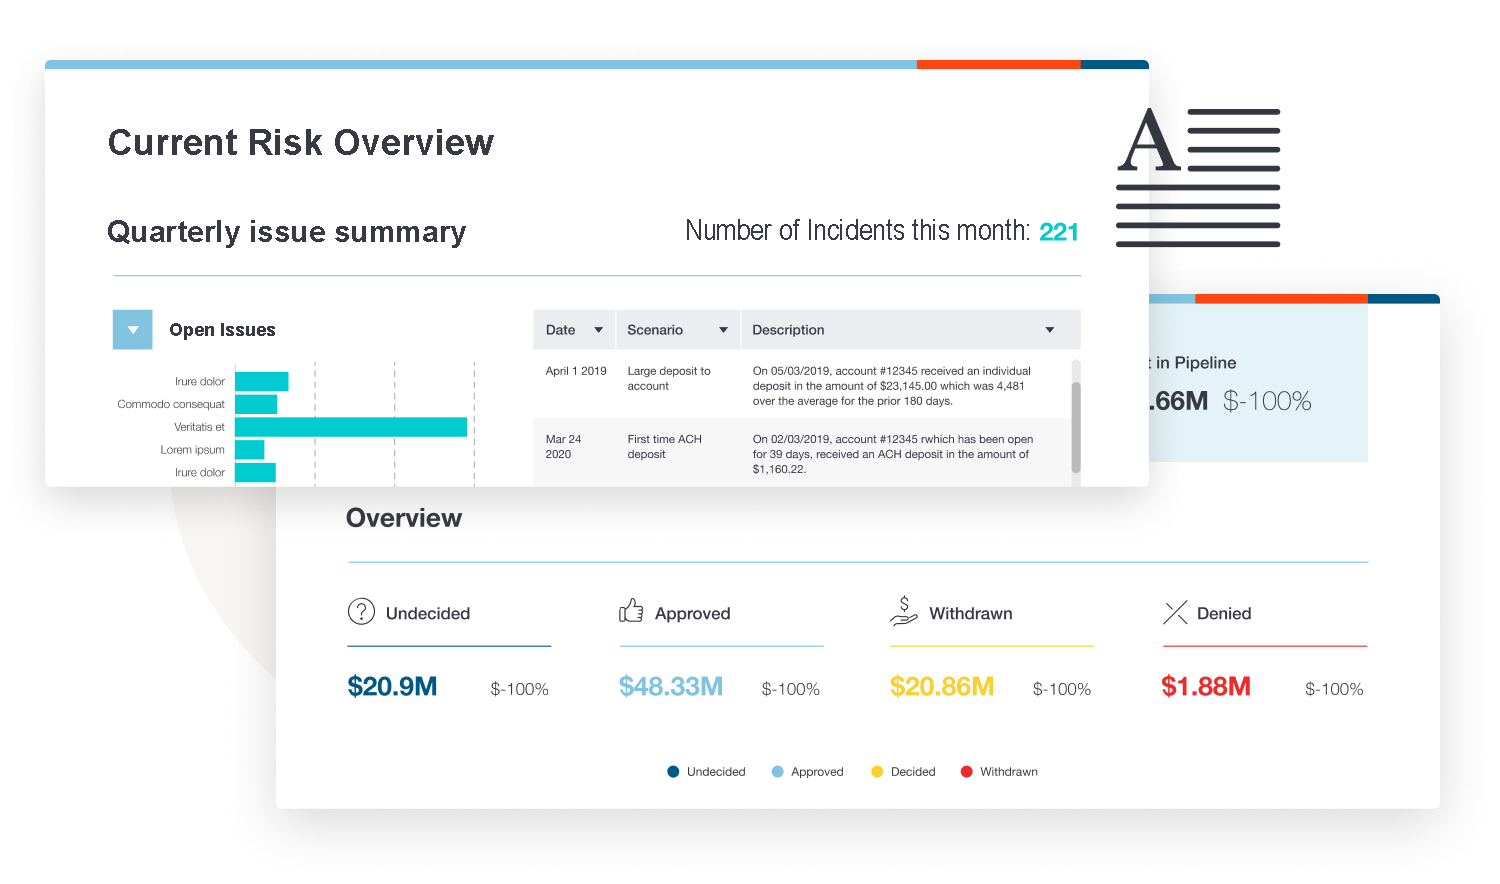
Design custom Word document templates

icon-automated-control-definitions-1

Magic tags accomodate text and tables

icon-work-your-way

Save your templates for easy reuse

icon-24hr-support

Generate and download reports in seconds!
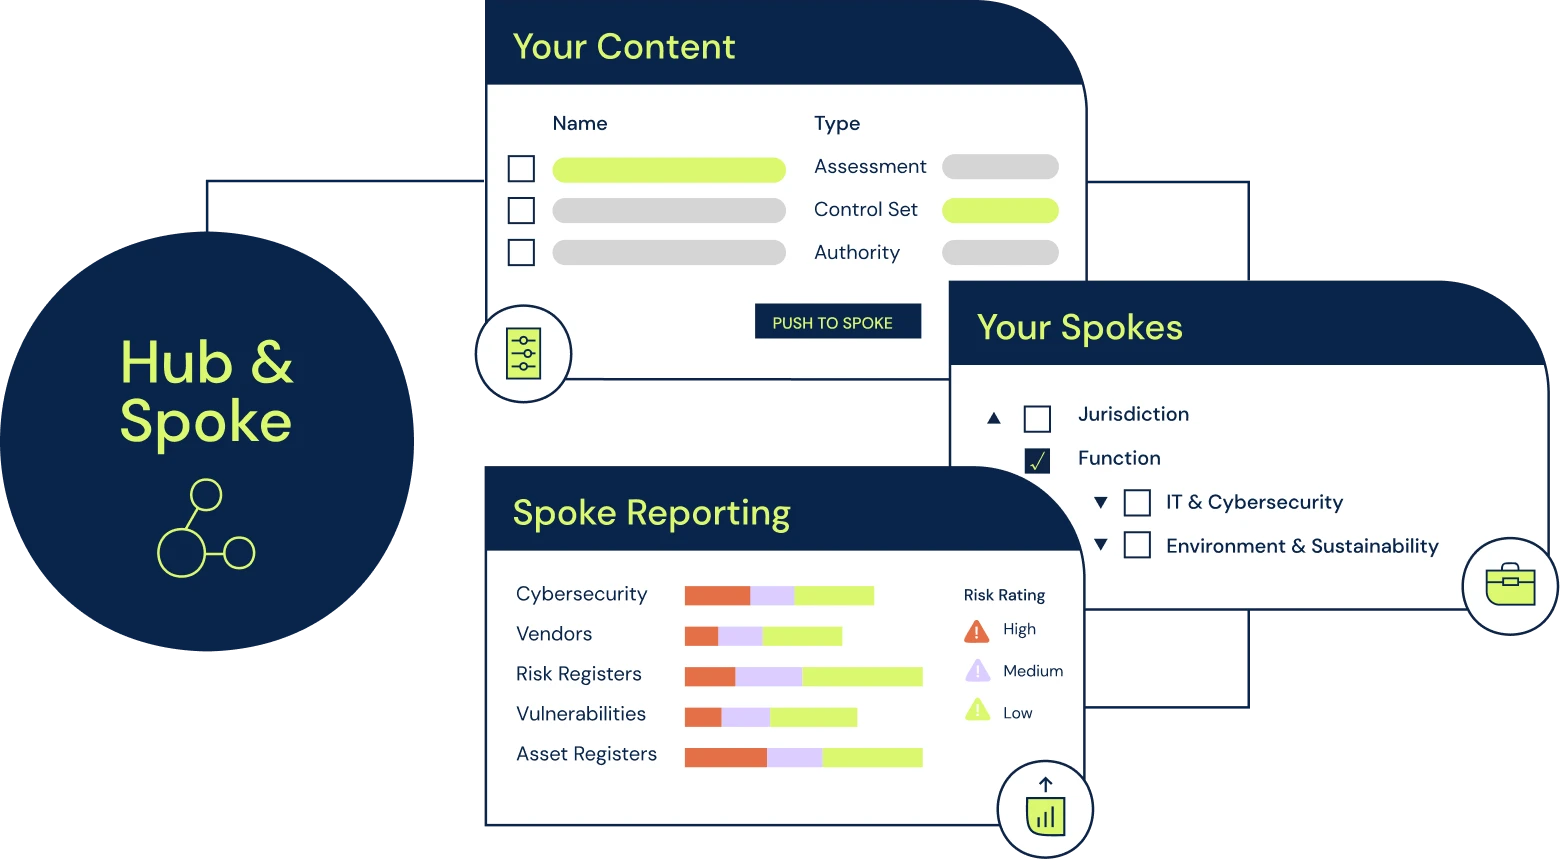
Our Built-in 6clicks Pixel Perfect Reports

PCI DSS RoC Reporting

We help distribute and collect evidence for PCI assessments, track issues through a remediation lifecycle, and create the PCI DSS Report on Compliance (ROC) with a single click.

Industry Standard Reports

Make it easy to deliver on industry-standard reports like PCI SAQ templates, ISO Statement of Applicability, System Security Plans, and more. Complete your audit or assessment in 6clicks and let us do the rest.

Customized Reporting

Standardize report delivery, minimize efforts, and create repeatability with customized reporting templates in Word format populated with the required data directly into the template.

Advanced Report Builder

When you need advanced reporting functionality, like sparklines, specific formatting or adding sections, the 6clicks Advanced Report Builder enables data analysts to create any content required. Incredibly deep functionality and a simple drag-and-drop wizard supports most data visualization requirements.

Powerful

Advanced query capability

6clicks' Advanced Report Builder is the most innovative GRC reporting solution on the market. Data analysts can create reports that include subqueries, advanced functions, linked filters and more — enabling them to deliver the risk and compliance insights they demand.
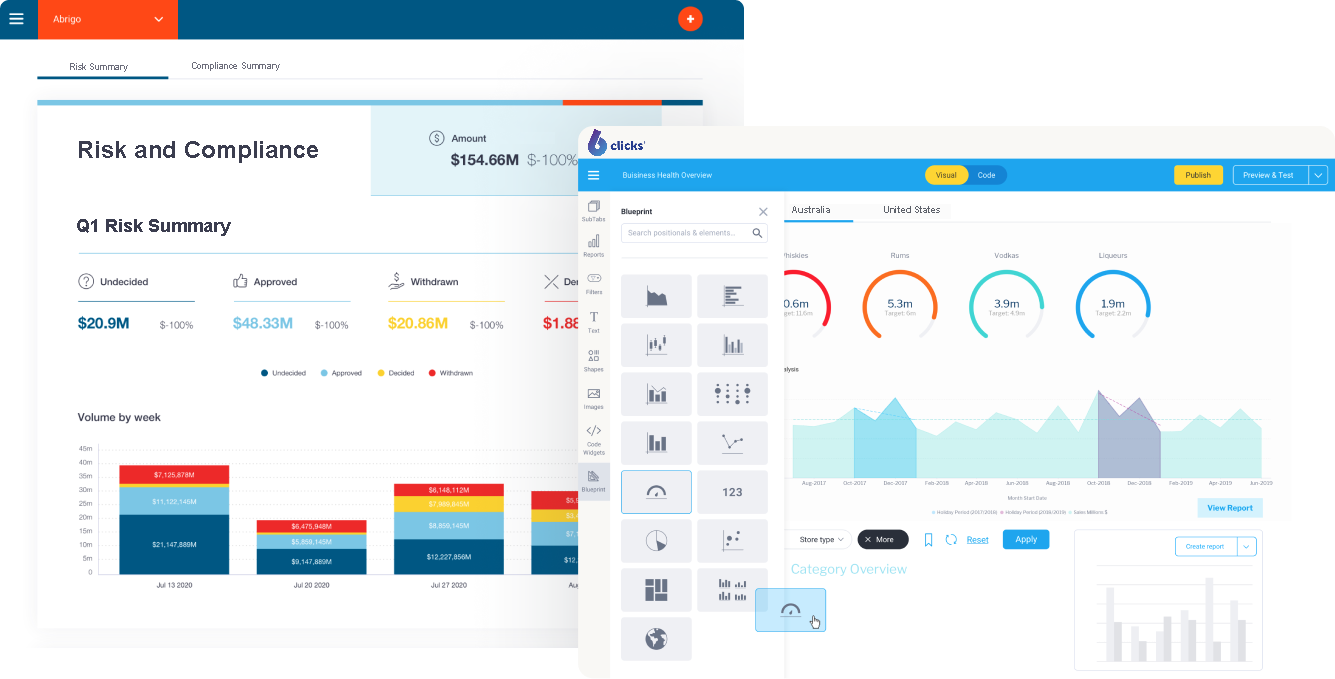
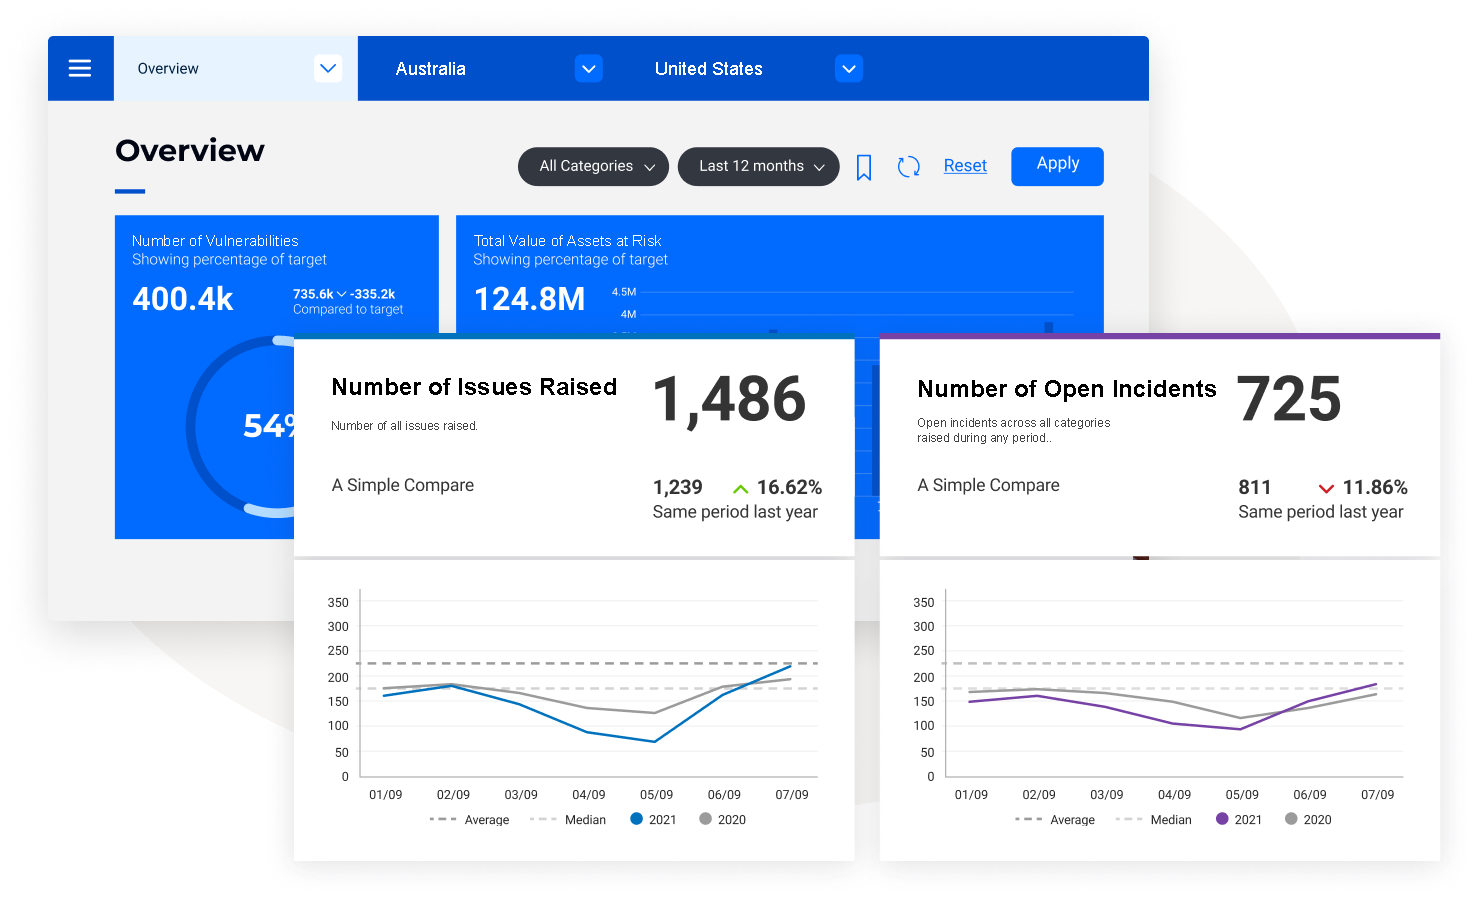
6clicks Data Visualization Self Service Reporting
Data Visualization Custom Dashboards

Visual

Create stunning visualizations

Give life to your data with stunning interactive visualizations. Understand your business from all perspectives with more than 50 chart types — from trellis charts to GIS maps and infographics. 
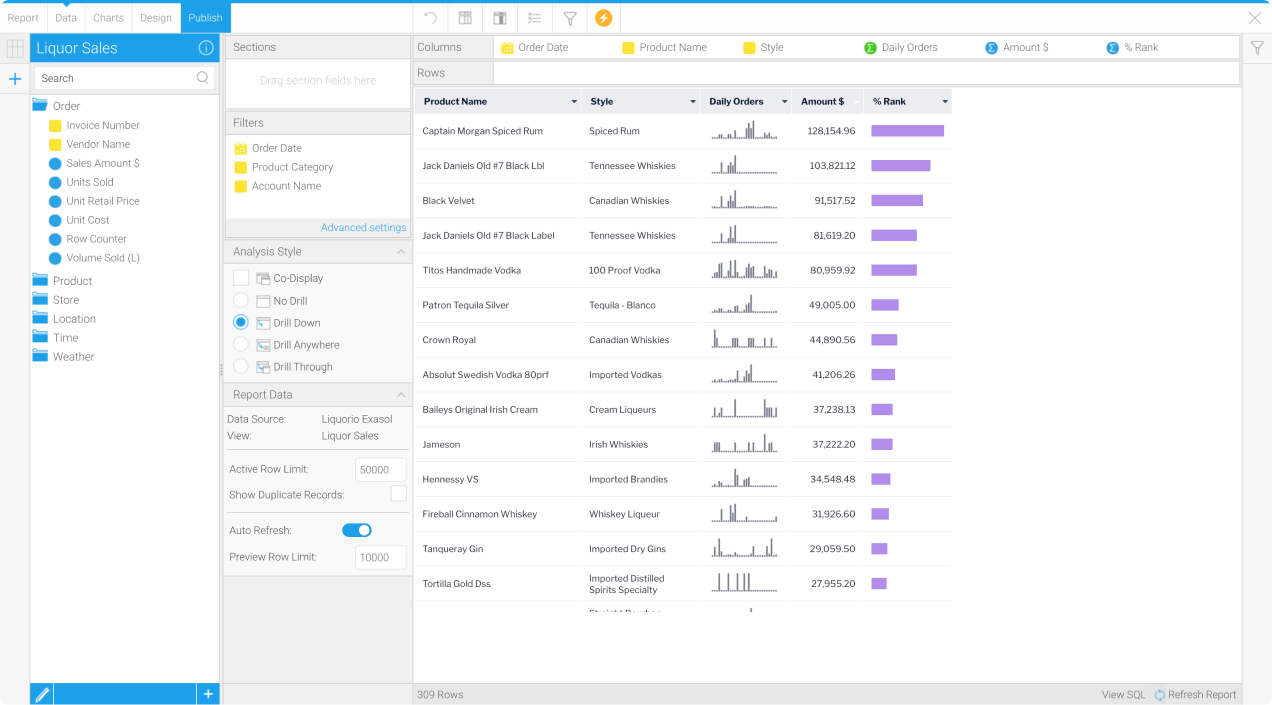
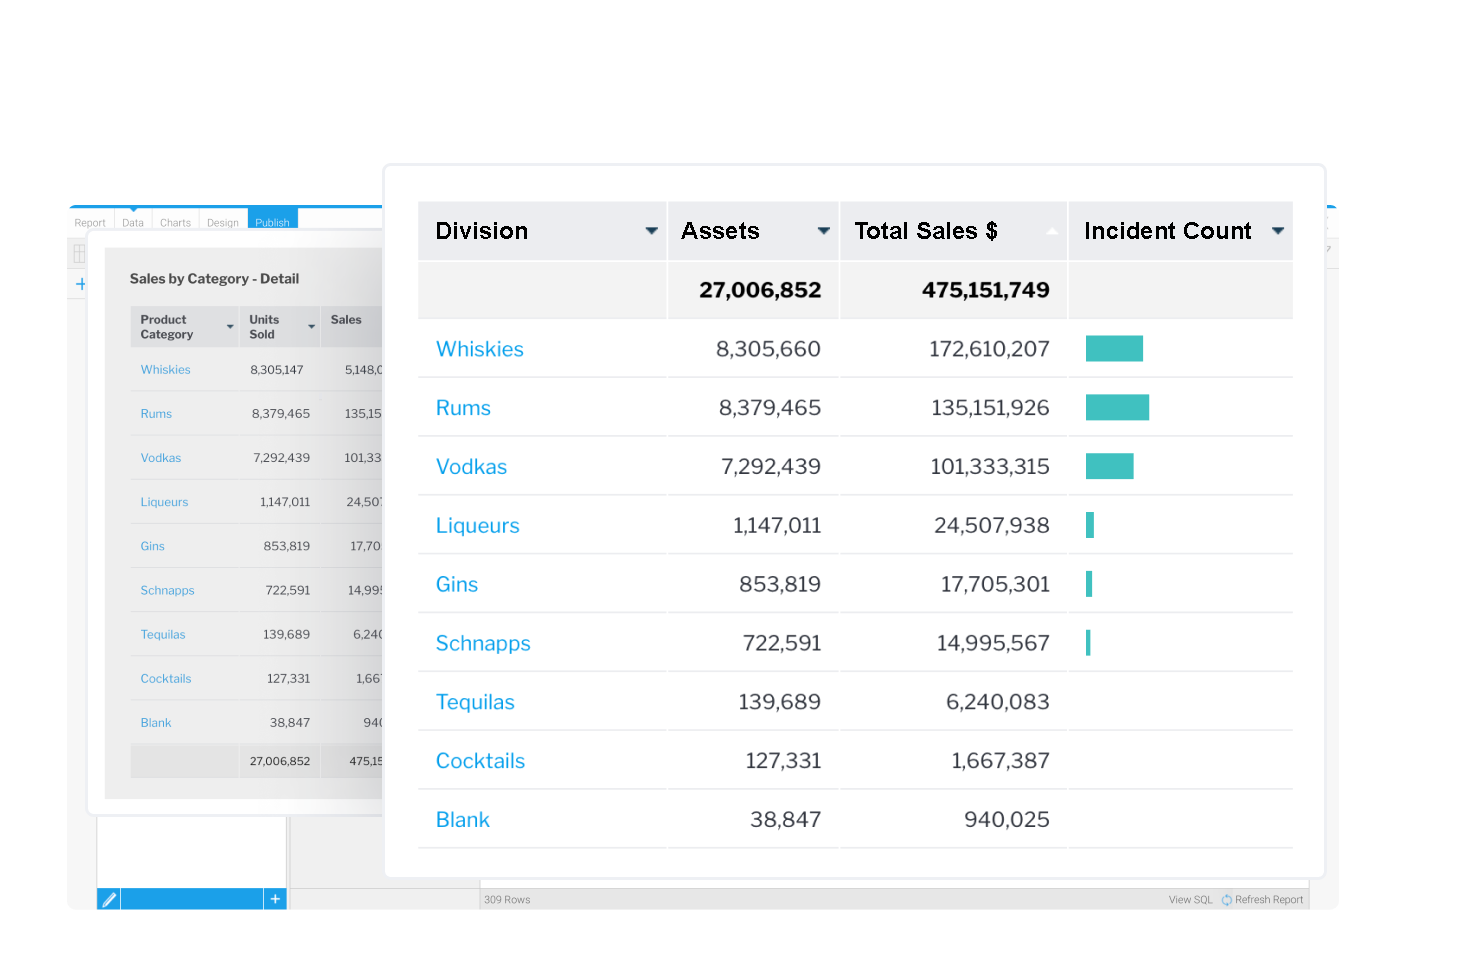
Tables

Stylish table formatting

Whilst charts and visualizations are the go-to standard, tables can be exceptionally useful for dense visual design, and in many cases a better way to communicate data than a chart. Use sparklines, bar formatters and conditional formatting to make your tables pop.

6clicks Data Visualization Tables_1
6clicks Data Visualization Text

Text and Typography

Tell it like it is

Make use of dynamic text options to create text prompts, titles or explanations of your data. 6clicks makes it easy by linking text parameters to filter inputs or data outputs, and provides rich formatting options to make your text really stand out.

6clicks Data Visualization Shapes

Shapes

Graphic components to create data experiences

Use shapes to highlight or draw attention to data. Boxes, arrows and lines help frame numbers, charts or text, and also draw attention to the data or create partitions so that a large canvas can be visually broken into separate sections.