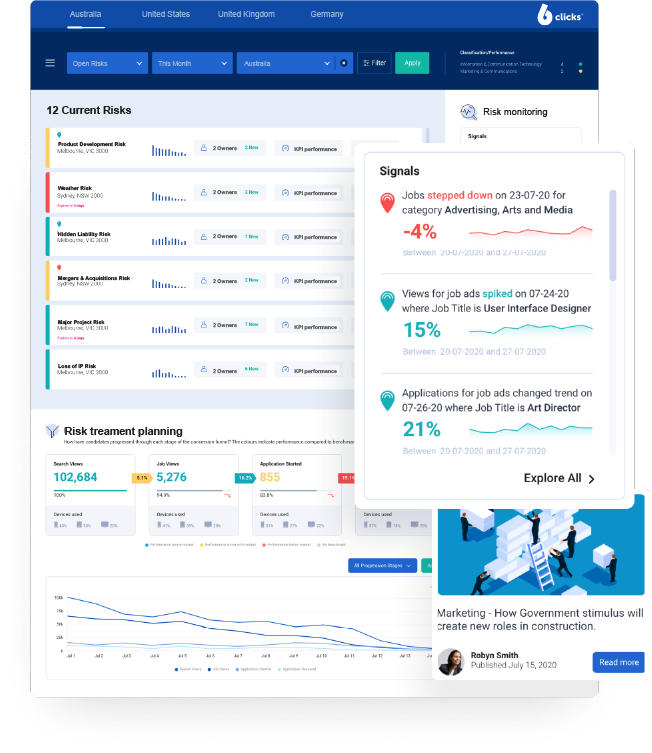
Beautiful.
Put simply, the world's most beautiful GRC dashboards
6clicks has created a dashboard canvas that users will love. Drag and drop charts and a range of graphics to easily assemble creative, pixel-perfect dashboards. In any grid or layout, you have the freedom to create engaging analytic experiences by adding shapes, text and images, and then augment the dashboard experience with LiveDocs™ for data storytelling.
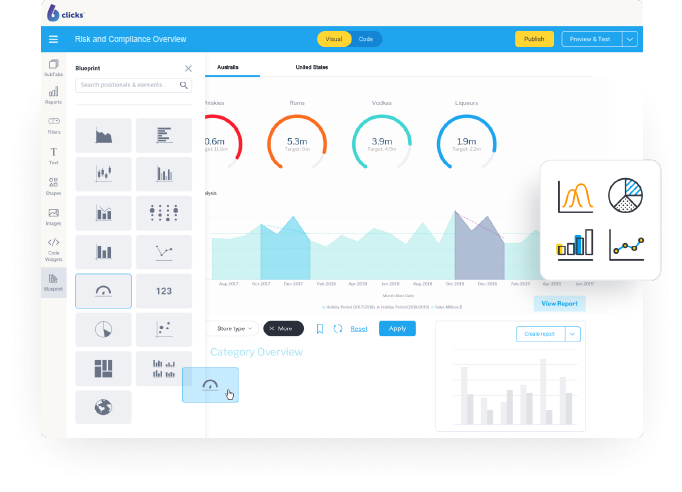
Flexible.
Do what you want to do.
6clicks Dashboards look great out of the box, but with our user-friendly design and developer tools, you can easily create highly customised dashboards to suit your specific needs. A free-form dashboard canvas your designers will love enables you to easily assemble creative infographics and actionable dashboards.
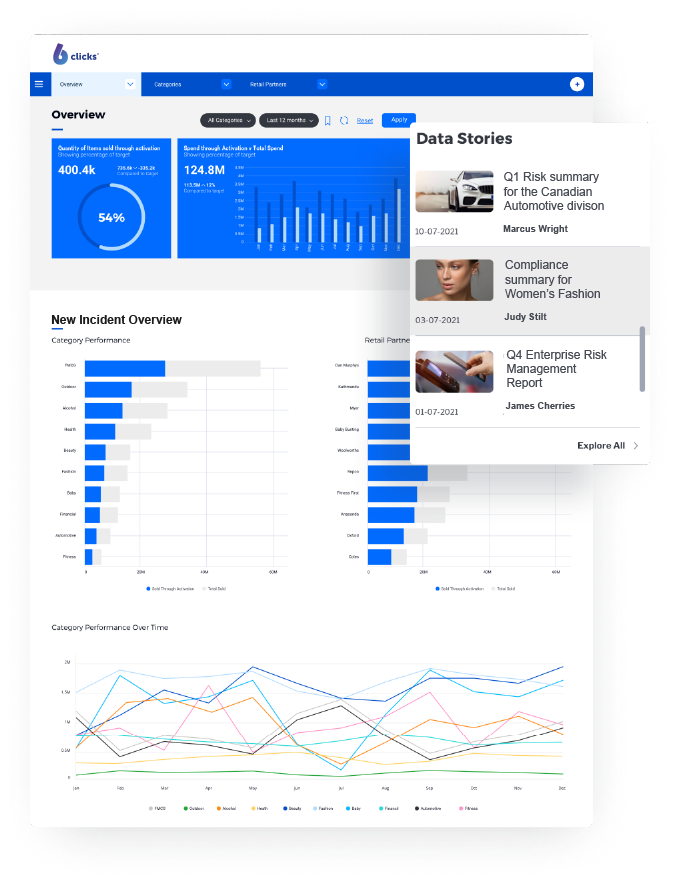
Contextual.
Tell the whole story
Increase the adoption and understanding of your dashboards by incorporating LiveDocs data stories directly within them. With a story widget, your users can access weekly, monthly or quarterly retrospectives that explain what happened, and why. Provide greater context and clarity for all your users by bringing the power of data and narrative together into your dashboards.