A narrative you can trust
Use LiveDocs for data storytelling
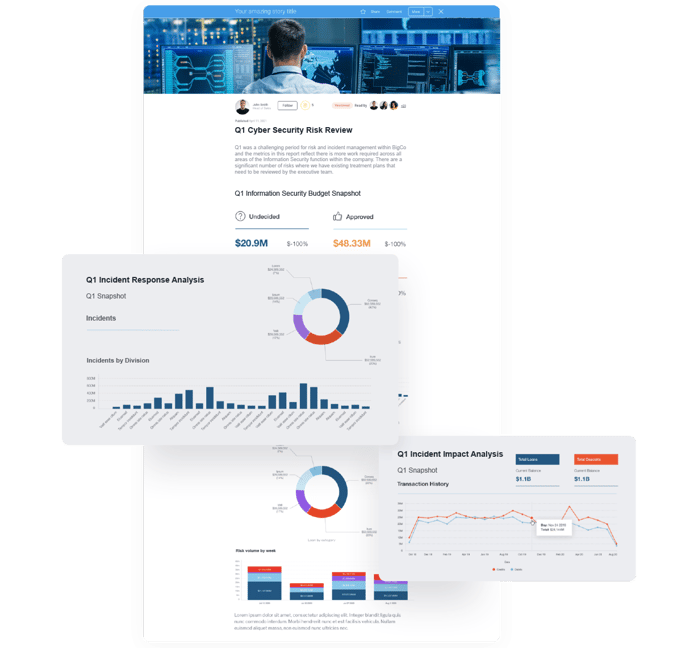
Improve data accuracy and timeliness by harnessing the full power of 6clicks LiveDocs for information presentation. This means that data from the 6clicks platform used in a LiveDocs story or presentation is up to date and accurate. This also eliminates the unreliable process of copying-and-pasting every time new information arrives, or old data is updated, allowing presentations and stories to be built once with data refreshed as often as needed, automatically, significantly reducing time and effort.
Do more together as a team
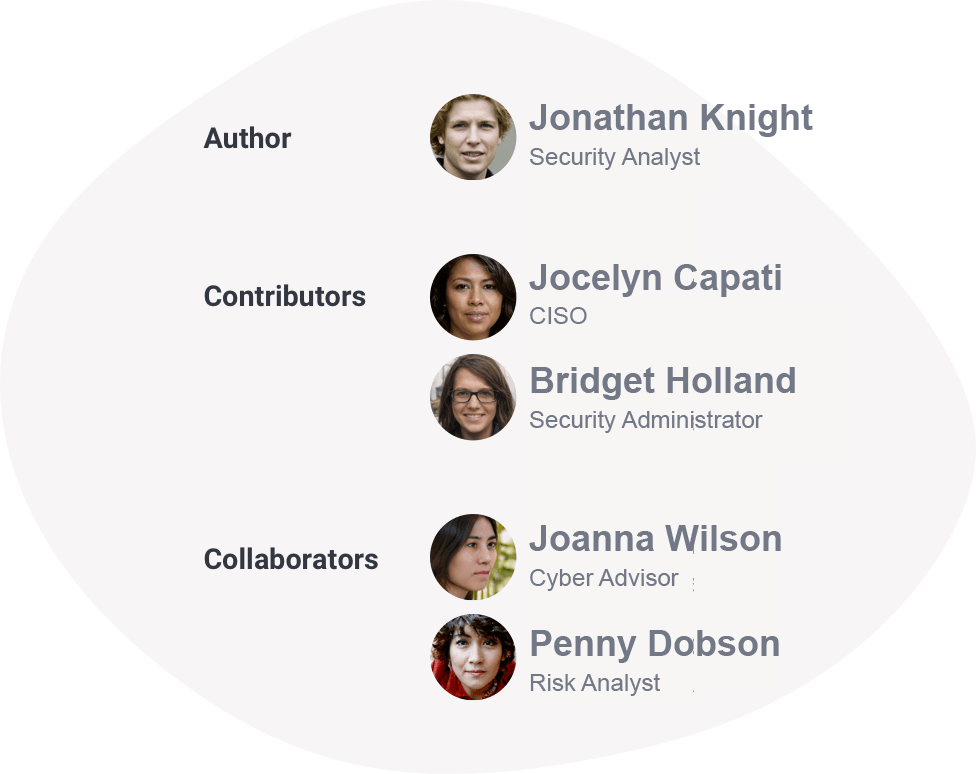
Collaborate on LiveDocs in real time
6clicks' collaboration features enable LiveDocs to be co-created by multiple contributors. Business users can easily collaborate to build compelling data stories or presentations that combine analysis with narrative to deliver a data driven storytelling experience more likely to persuade, inspire confidence, and empower change.
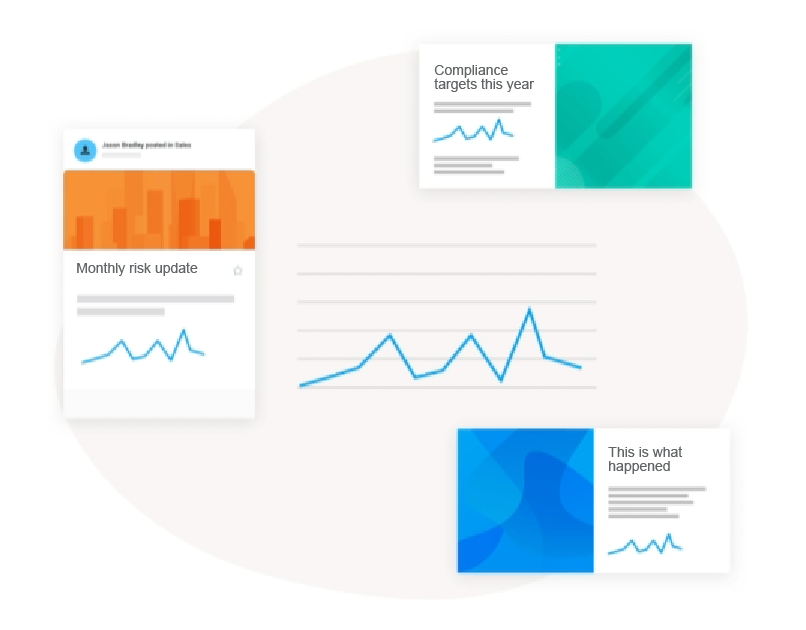
What's the story?
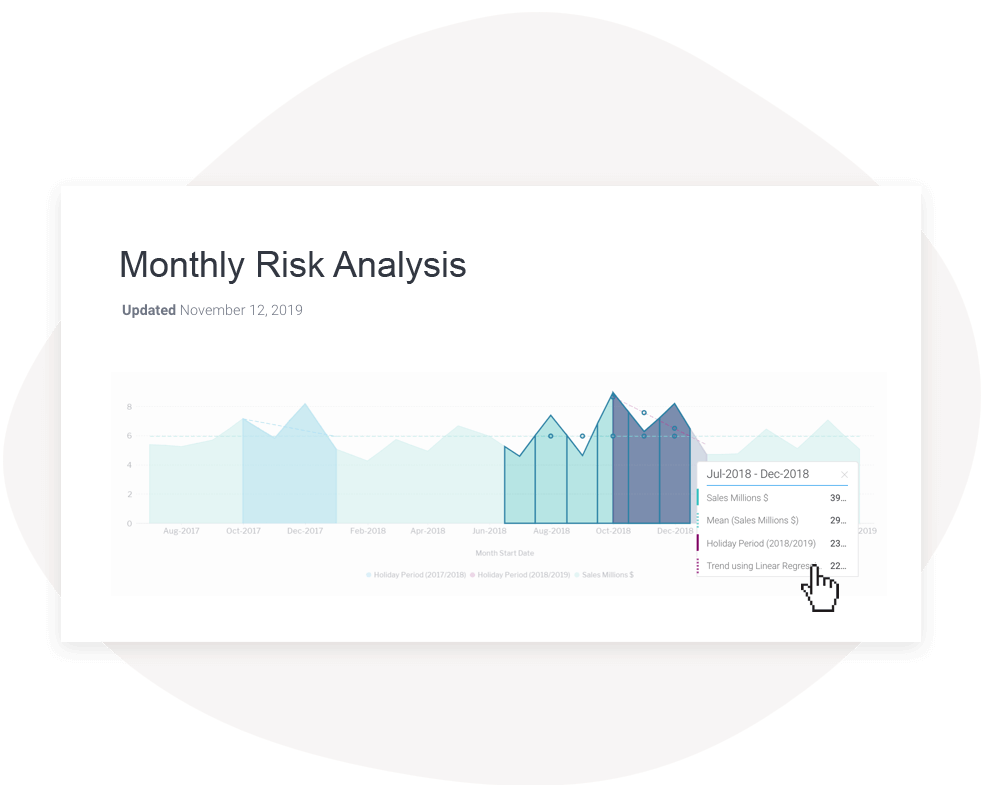
Embedded data in LiveDocs is always up to date
As embedded data is dynamic, viewers or readers of LiveDocs can drill into the detail and get behind the data. This interactive way to engage with a data story or presentation can improve understanding and decision-making with real-time, accessible insights.